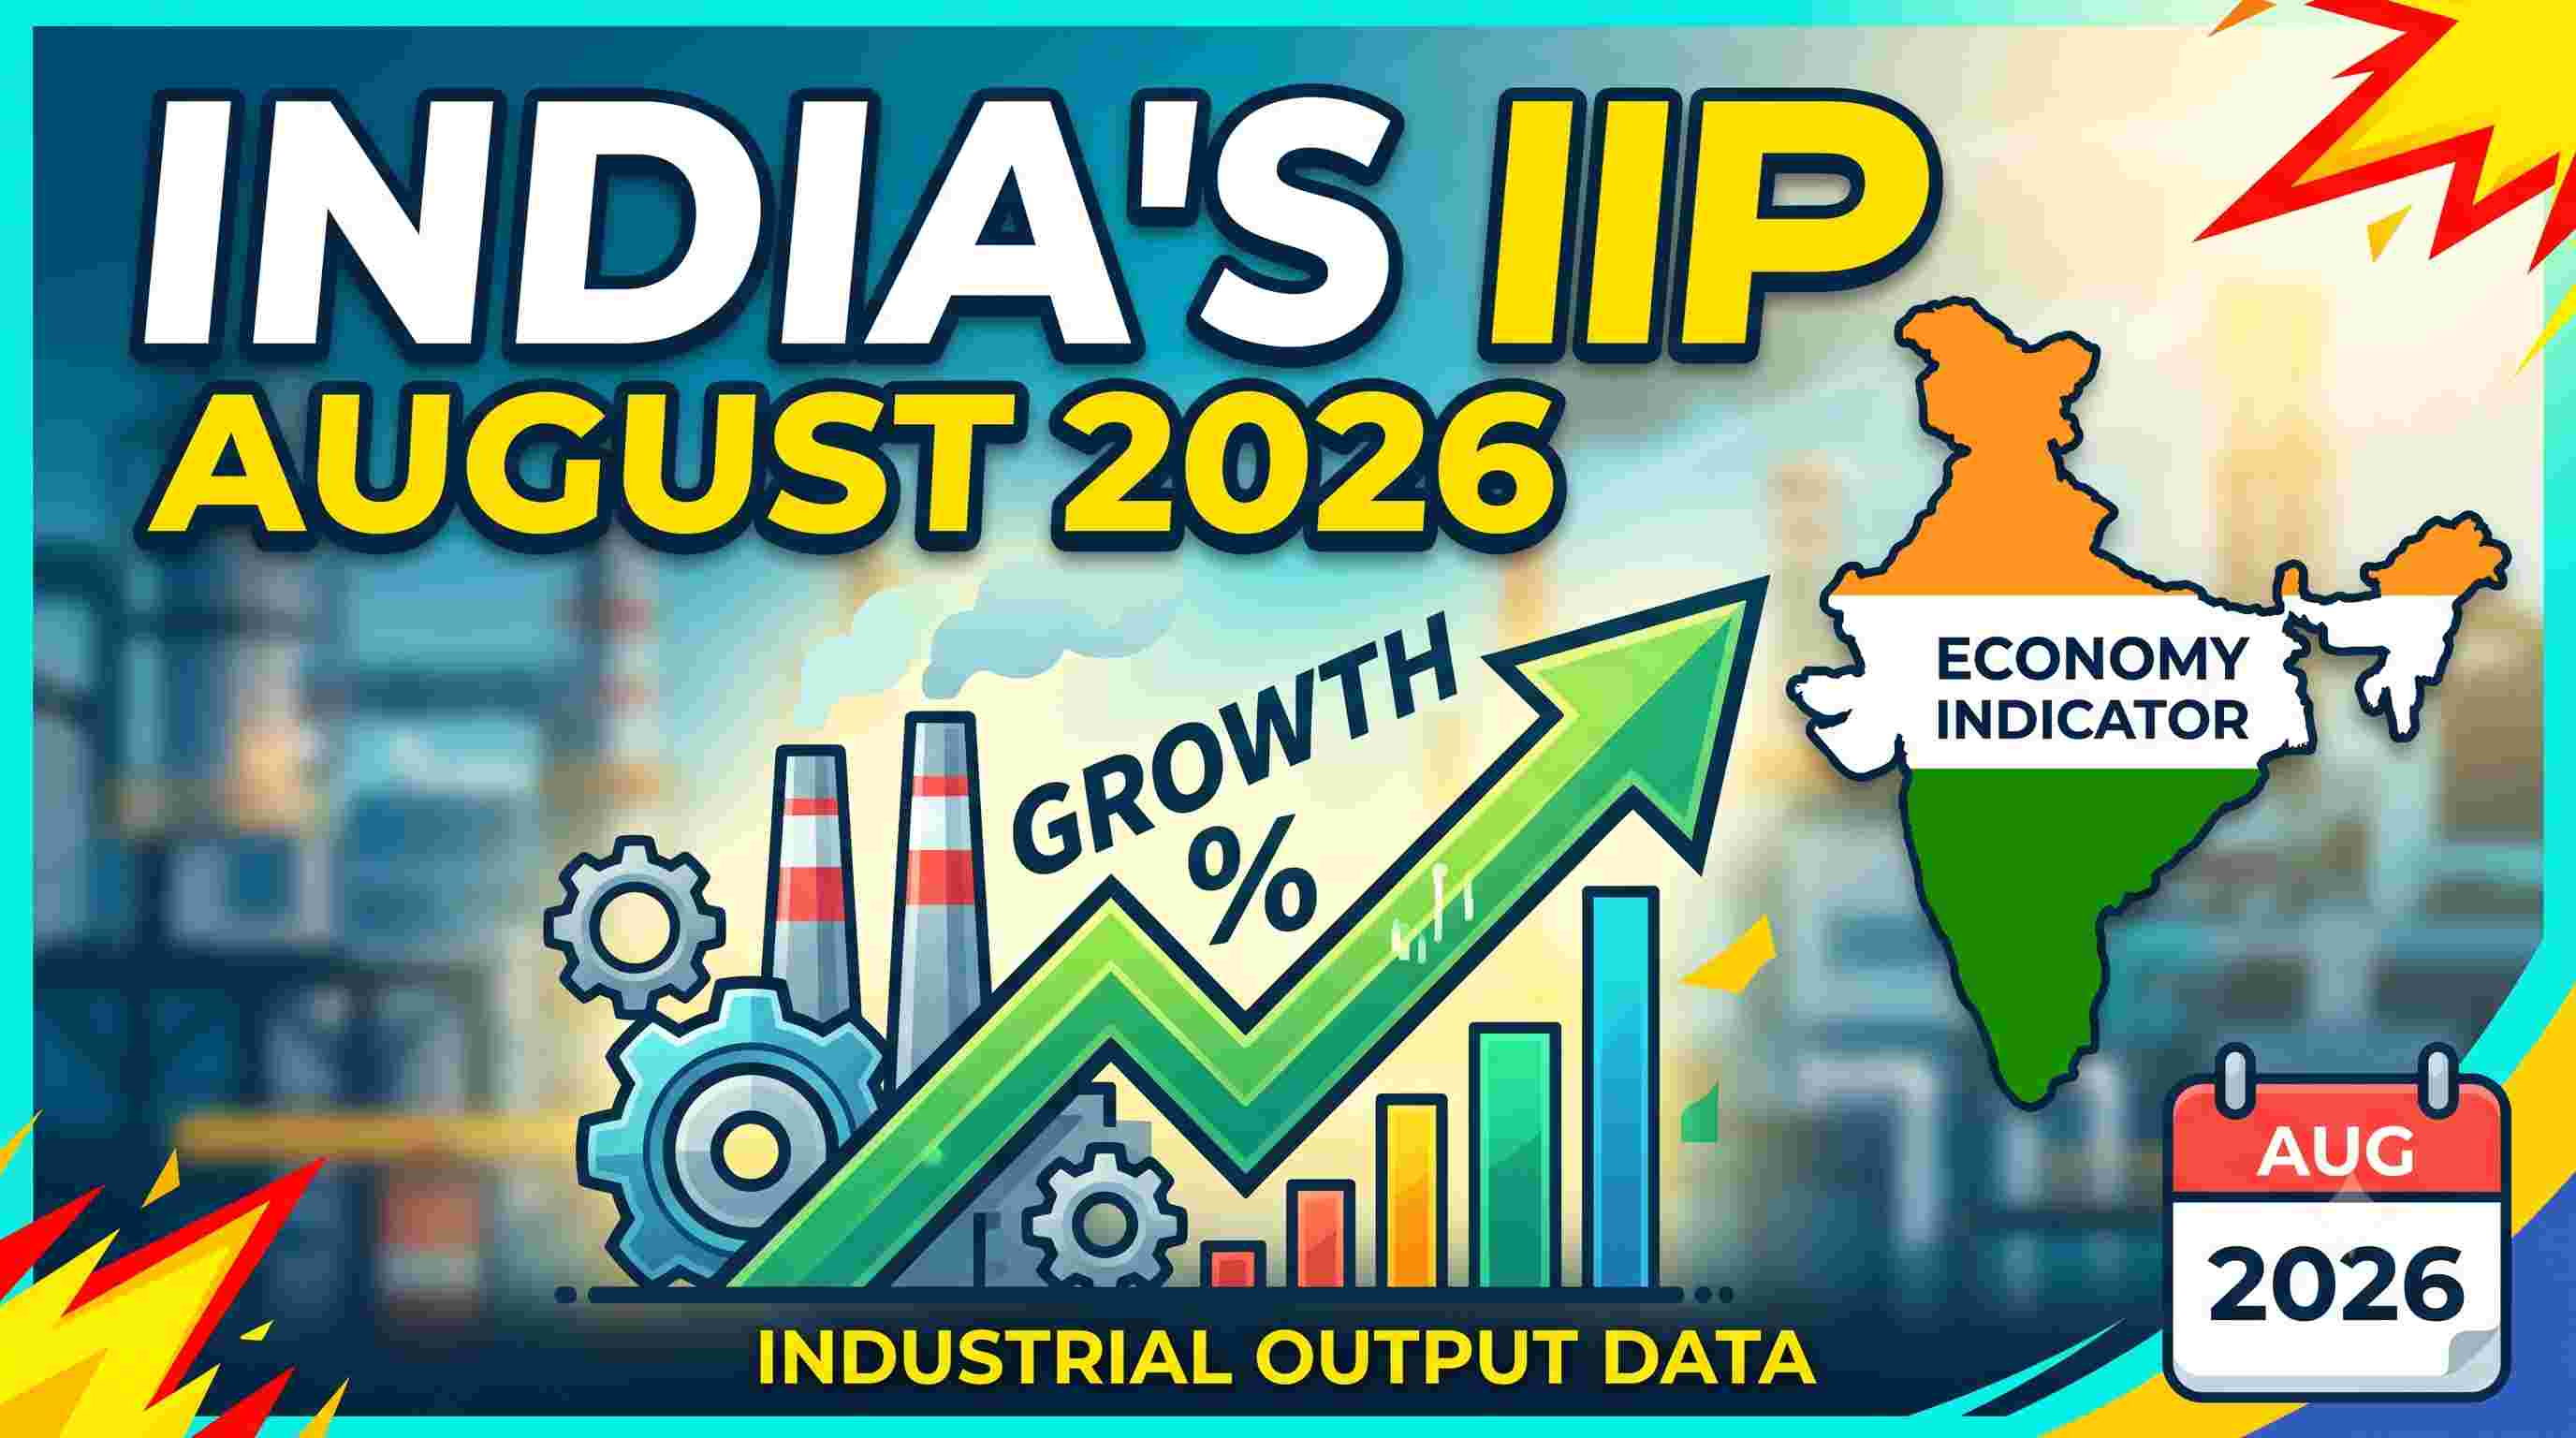
India's Index of Industrial Production (IIP) – August 2026
What Is the News?
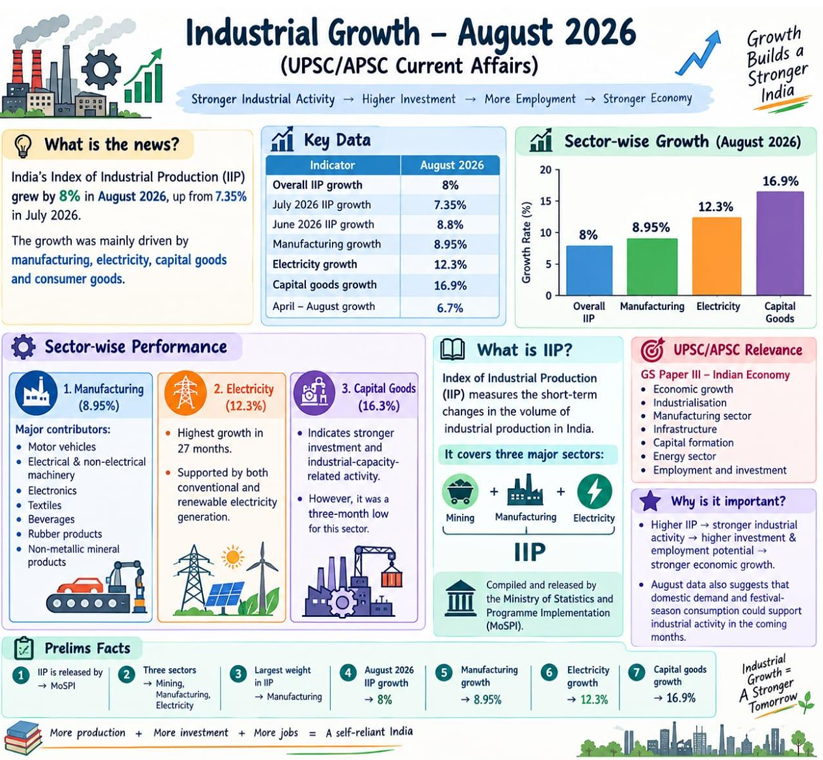
India’s Index of Industrial Production (IIP) grew by 8% in August 2026, up from 7.35% in July 2026. The growth was mainly driven by manufacturing, electricity, capital goods and consumer goods.
Key Data
| Indicator | August 2026 |
|---|---|
| Overall IIP growth | 8% |
| July 2026 IIP growth | 7.35% |
| June 2026 IIP growth | 8.8% |
| Manufacturing growth | 8.95% |
| Electricity growth | 12.3% |
| Capital goods growth | 16.9% |
| April–August growth | 6.7% |
Sector-Wise Performance
1. Manufacturing – 8.95%
Major contributors:
Motor vehicles
Electrical & non-electrical machinery
Electronics
Textiles
Beverages
Rubber products
Non-metallic mineral products
2. Electricity – 12.3%
Highest growth in 27 months.
Supported by both conventional and renewable electricity generation.
3. Capital Goods – 16.9%
Indicates stronger investment and industrial-capacity-related activity.
However, it was a three-month low for this sector.
What Is IIP?
Index of Industrial Production (IIP) measures the short-term changes in the volume of industrial production in India. It covers three major sectors:
Mining + Manufacturing + Electricity → IIP
It is compiled and released by the Ministry of Statistics and Programme Implementation (MoSPI).
Prelims Facts
IIP is released by → MoSPI
Three sectors → Mining, Manufacturing, Electricity
Largest weight in IIP → Manufacturing
August 2026 IIP growth → 8%
Manufacturing growth → 8.95%
Electricity growth → 12.3%
Capital goods growth → 16.9%
Mains Question
“India’s recent acceleration in industrial production indicates improving industrial momentum. Discuss the factors driving this growth and the challenges to sustaining it.” (150 words)